OONI releases new Web UI: Run censorship tests from your web browser!
Maria Xynou, Arturo Filastò, Vasilis Ververis
2016-12-13

Today we are excited to announce the beta release of our new web-based user interface
(WUI) that enables OONI Probe users to run censorship tests from a web browser!
Whether you’re running OONI Probe from your desktop or a Raspberry Pi, you can
now easily choose which tests you want to run through OONI’s web UI and run them
with the click of a button. These tests
are designed to examine the following:
Once you have run the tests of your choice, you can then view the results of
your measurements in the web UI. The results will illustrate whether and what
types of censorship events have occurred in your network, and you will be
provided with tips on how to circumvent those specific types of censorship.
OONI’s new web UI also includes an informed consent procedure and provides users
with data opt-out choices.
Below we provide a guide on how to access OONI’s web UI and run tests from it.
Install ooniprobe or copy an image
Currently ooniprobe is designed
for Mac OS and Linux operating systems. If you’re a Windows user eager to run
ooniprobe, then you might be interested in running our distribution for Raspberry Pis.
ooniprobe desktop version (Mac OS & Linux users)
Learn how to install ooniprobe, depending on your operation system,
here.
ooniprobe distribution for Raspberry Pis
Copy ooniprobe’s distribution for Raspberry Pis onto an SD card. You can find a
guide on how to do so here.
Then insert your SD card (containing ooniprobe’s distribution) into a Raspberry
Pi and connect it to power and to the internet (with an ethernet cable).
Setup Wizard
If you plan on running ooniprobe’s desktop version, type the following in your
terminal:
ooniprobe-agent start
This should present you with the following URL: 127.0.0.1:8842
By clicking on it, you will be directed to OONI’s web UI Setup Wizard:
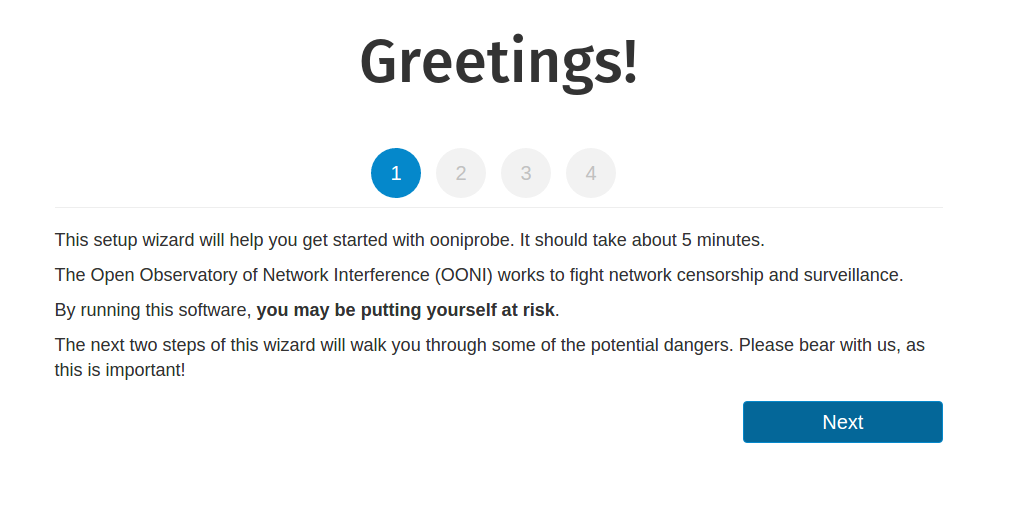
If you plan on running OONI Probe from a Raspberry Pi, type the following URL in
your web browser: http://lepidopter.local
Note: Type the above URL only once your Raspberry Pi is connected to both power
and the internet, and it has started (this usually takes about a minute).
You should now be presented with OONI’s web UI Setup Wizard.
If this doesn’t work, try accessing the web UI by typing http://lepidopter in
your web browser. And if that also doesn’t work, please find more information
here.
Upon clicking Next in the Setup Wizard, you will view information about
potential risks associated with running OONI Probe.
Risks: Things you should know before running OONI Probe
Running OONI Probe can potentially be a risky activity. To our knowledge, no one
has ever gotten into any trouble as a result of running OONI Probe. Nonetheless,
we strongly encourage you to read this documentation carefully and to consult
with a lawyer, if needed.
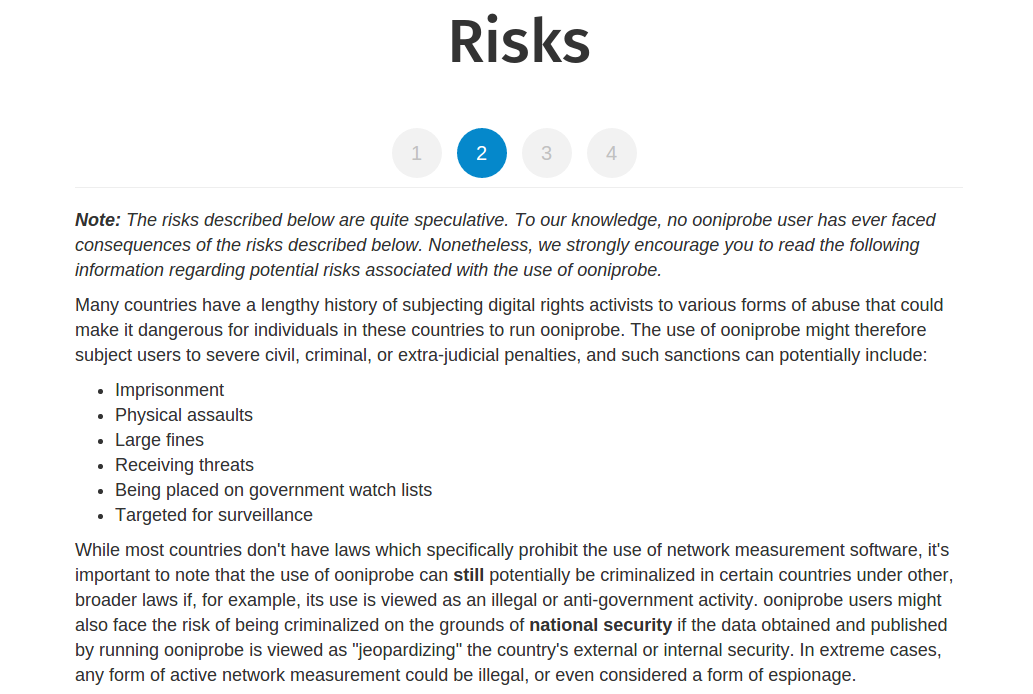
Once you have read and understood the potential risks associated with running
OONI Probe, click Next.
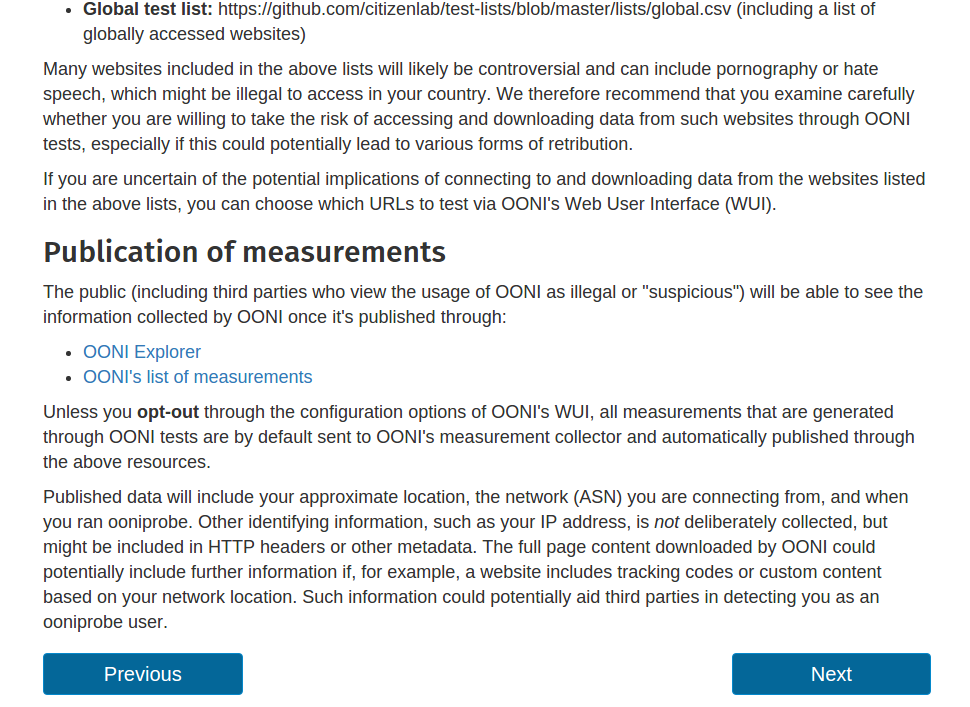
Quiz: How well do you understand potential risks?
You didn’t read the somewhat long Risks documentation for nothing. To make
things fun, you will be presented with a quiz including a set of questions that
you need to answer correctly, demonstrating that you have a basic understanding
of potential risks associated with the use of OONI Probe.
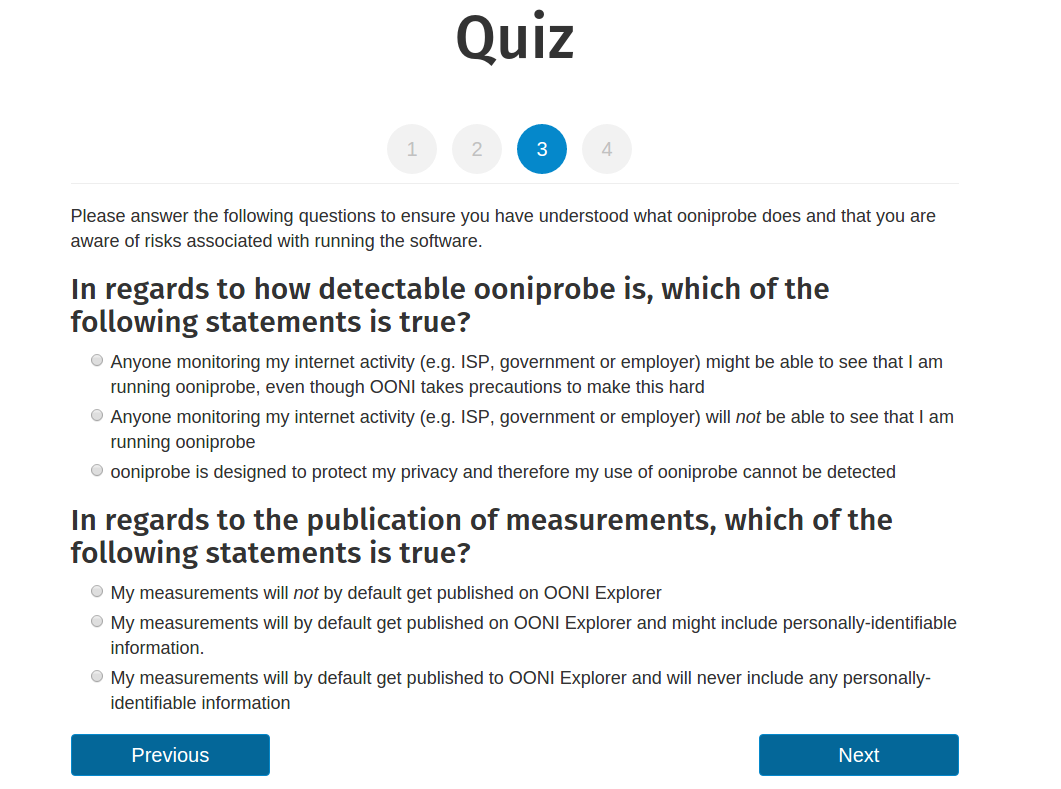
Don’t worry if you don’t answer the questions correctly the first time, the
wizard will redirect you back to the Risks documentation so that you can have
another chance to read through the relevant information. Once you have answered
the questions correctly, you will then be directed to the wizard’s Configuration
page.
Configuration options: Choose the decks you want to run
By default, all sets of tests (called decks) are enabled. This means that upon
clicking Configure, tests will automatically be run daily (from your computer or
Raspberry Pi) to examine the following:
Reachability of the Tor network
Blocking of websites
Blocking of instant messaging (IM) apps
Presence of systems that could be responsible for censorship or surveillance
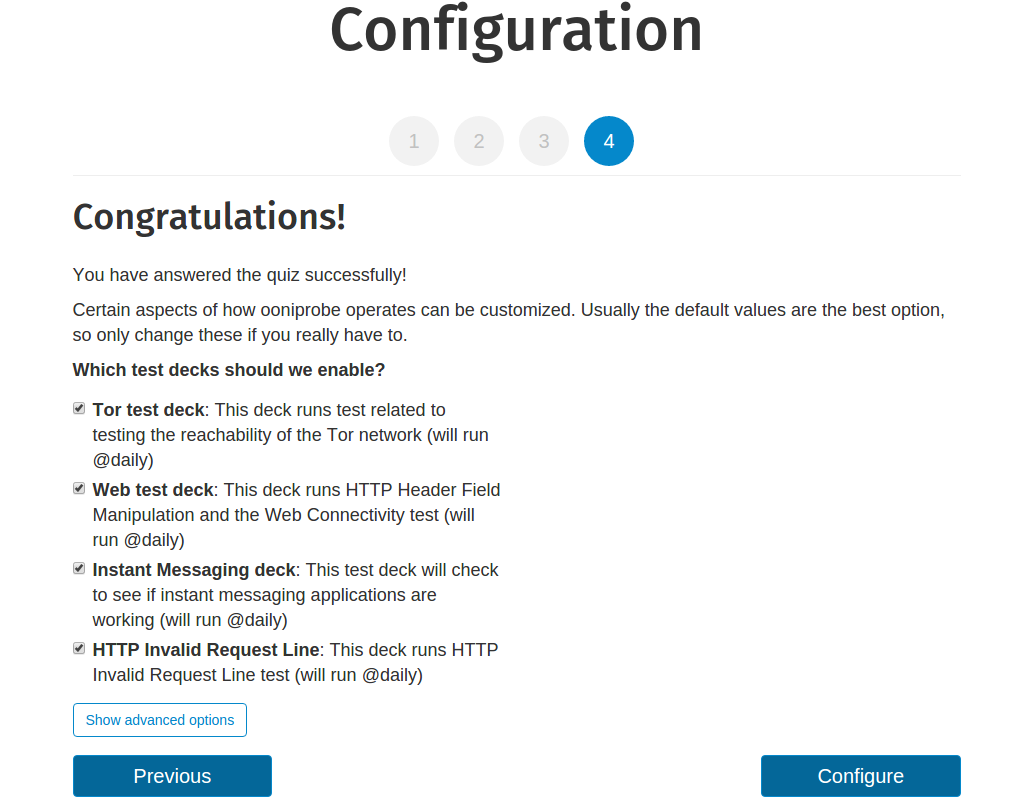
To prevent any of these tests from automatically being run, uncheck their
associated boxes. You can also re-configure your decks through OONI’s web UI
once you have completed all the steps in the setup wizard.
To make further choices, click Show advanced options.
Opt-out: Data choices you can make
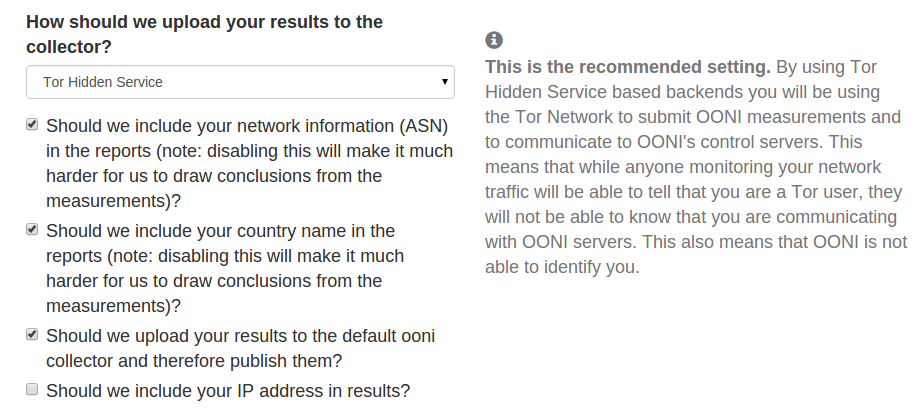
Here you have choices in terms of what types of data to disclose, whether to
have your measurements published and if so, how to upload them to OONI’s
measurement collector.
We recommend the default options included in the configuration settings.
ASN and country name
We encourage users to enable the collection of identifiers based on their
network (ASN) and the country that they are running OONI Probe from because
without this information, we cannot attribute specific measurements to a
specific country and network. In other words, without this information we are
not in a position to know where the measurements are coming from, limiting the
objectives of this research.
IP address
The inclusion of IP addresses is disabled by default because this information
can potentially help third parties identify OONI Probe users. However, including
your IP address can help improve the analysis of measurements.
Uploading measurements
We also enable users to choose whether they would like their measurements to be
uploaded to OONI’s measurement collector by default or not. If your measurements
are collected by OONI, they will be processed and published on OONI Explorer and on OONI’s list of measurements.
OONI publishes all network measurement data that it collects and
processes because open data allows third parties to conduct independent studies,
to verify OONI findings and/or to answer other research questions. If you choose
to opt-out from sending data to OONI’s measurement collector your results will
not be publicly available, and you will need to process them yourself. This
option is sometimes chosen by users who prefer to not have their measurements
published due to potential risks that could emerge as a result of such
publication.
How to upload measurements
If you decide to have your measurements sent for processing and publication, you
can subsequently choose how you would like to have them sent to OONI’s
measurement collector.
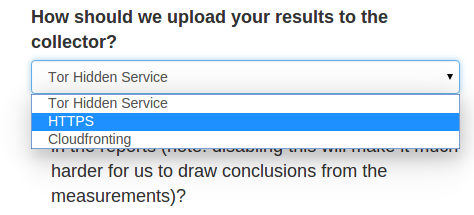
Here you have three choices:
Tor hidden services
HTTPS collectors
Cloud-fronting
Tor hidden services should be the best option for most users because it prevents
OONI from seeing your IP address and it makes it harder for a network adversary
to fingerprint your use of OONI Probe. This however requires the installation of
tor software and you should expect connections to
OONI’s measurement collector to be slower.
If you would rather not use tor software but you would also like to make it
harder for a network adversary to identify you as an OONI Probe user, you can
choose to submit your measurements via cloud-fronting. But if you don’t care
about your ISP knowing that you are running OONI Probe and you want better
performance, you can choose to submit your measurements via HTTPS collectors.
Running OONI Probe through OONI’s web UI
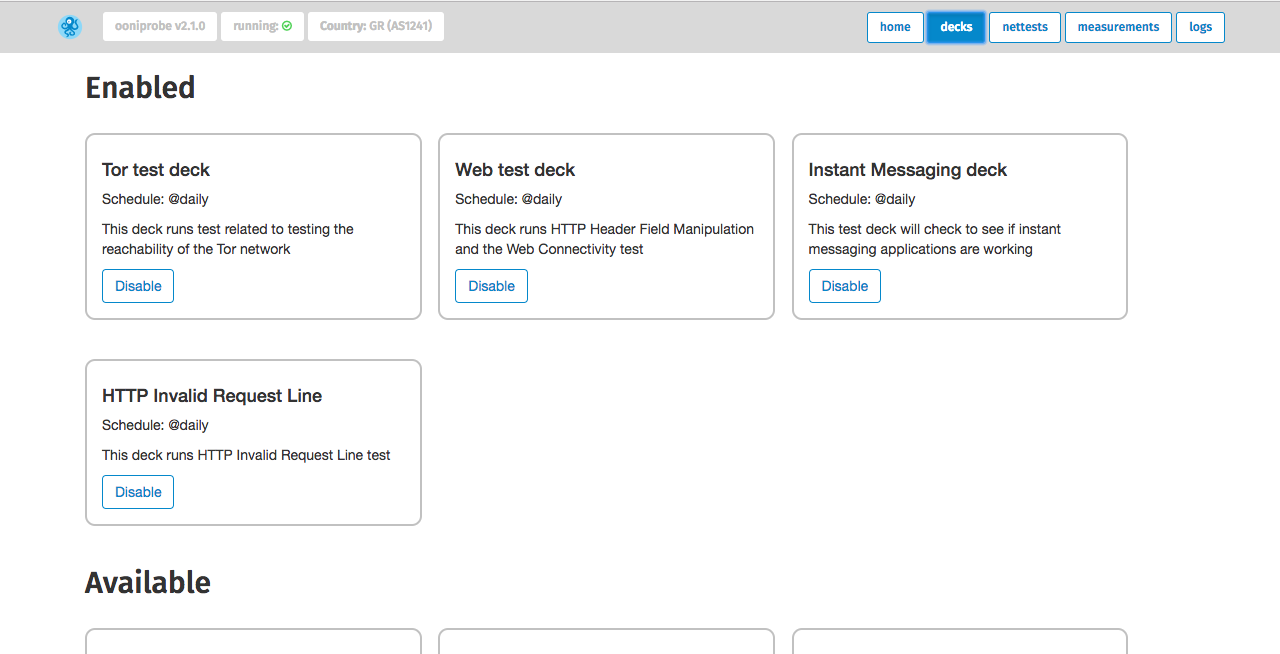
Upon configuration of your settings you will be presented with OONI’s web UI.
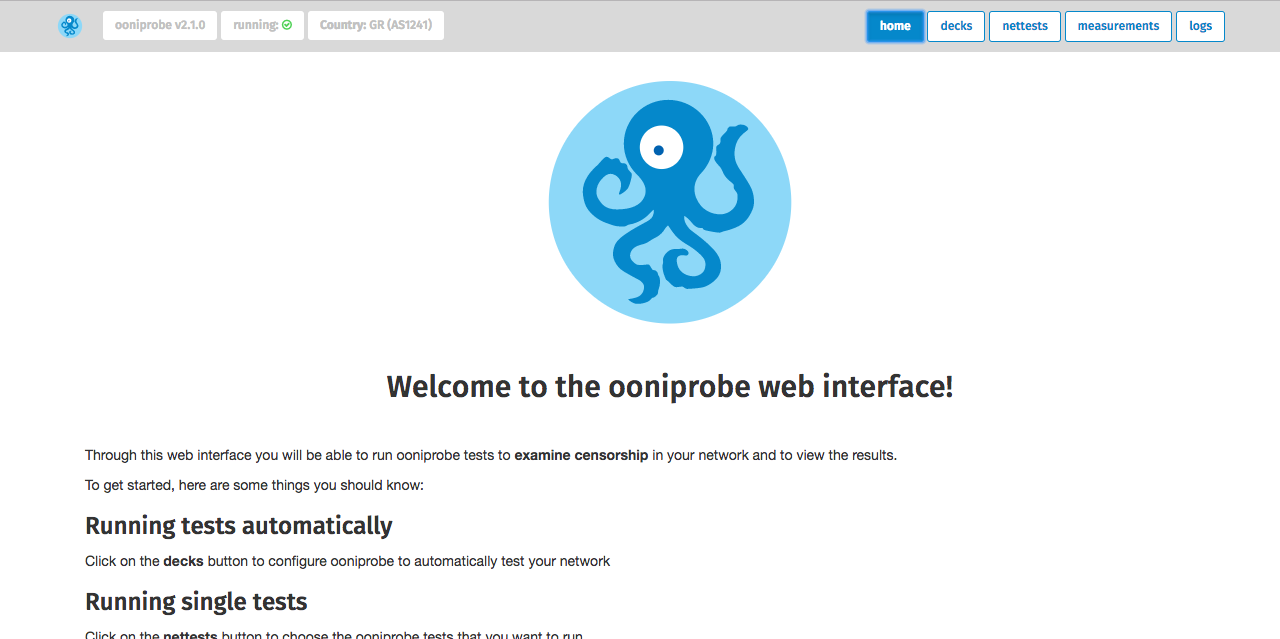
By clicking on decks you will be able to re-configure the sets of tests that you
want to run automatically, as explained in the previous section.
By clicking on nettests you will be presented with OONI software tests that you
can choose from.
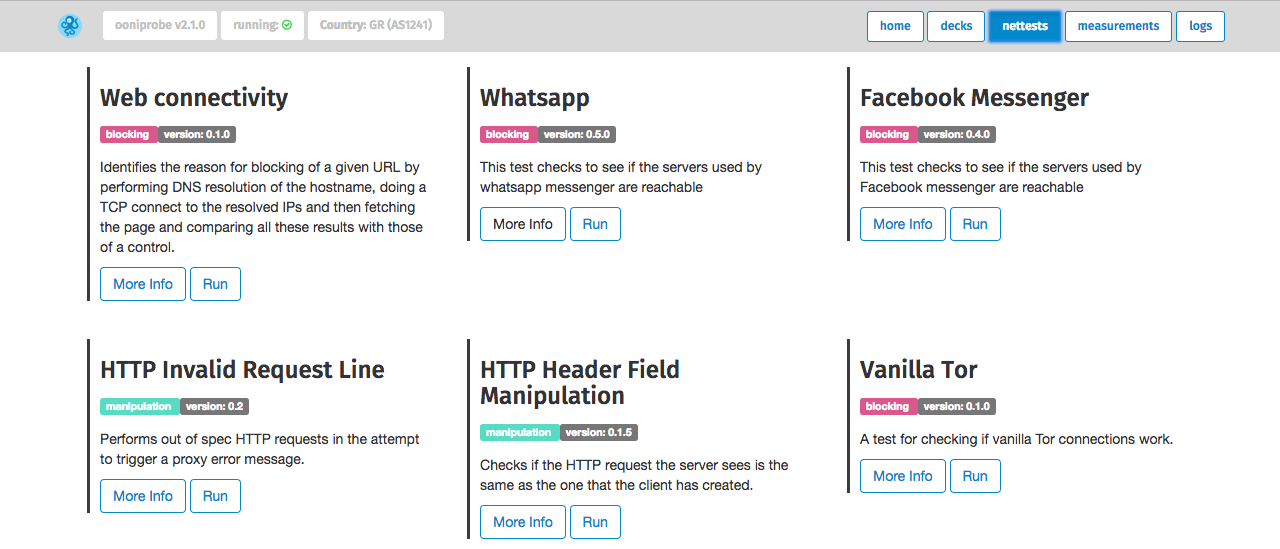
The three main tests (web connectivity, HTTP header field manipulation and HTTP
invalid request line) are included in OONI Probe’s main software suite. Web connectivity allows you
to test a set of URLs to examine whether and how they are blocked. The HTTP header field manipulation and HTTP invalid request line tests, on
the other hand, examine whether systems that could potentially be responsible
for censorship and surveillance are present in your network. Prior to running
these tests, we urge you to read relevant
documentation carefully and to
understand what each software test does.
By clicking Run next to the test of your choice, that test will start running.
If you have, for example, chosen to run the Web Connectivity test, add the URL
that you want to test and/or select the “list of globally accessed
websites” in the file drop-down menu.

Then click Start Net Test.
Viewing your measurements
Once you have started running tests, click on measurements to view a list
containing the results for each test that you ran.
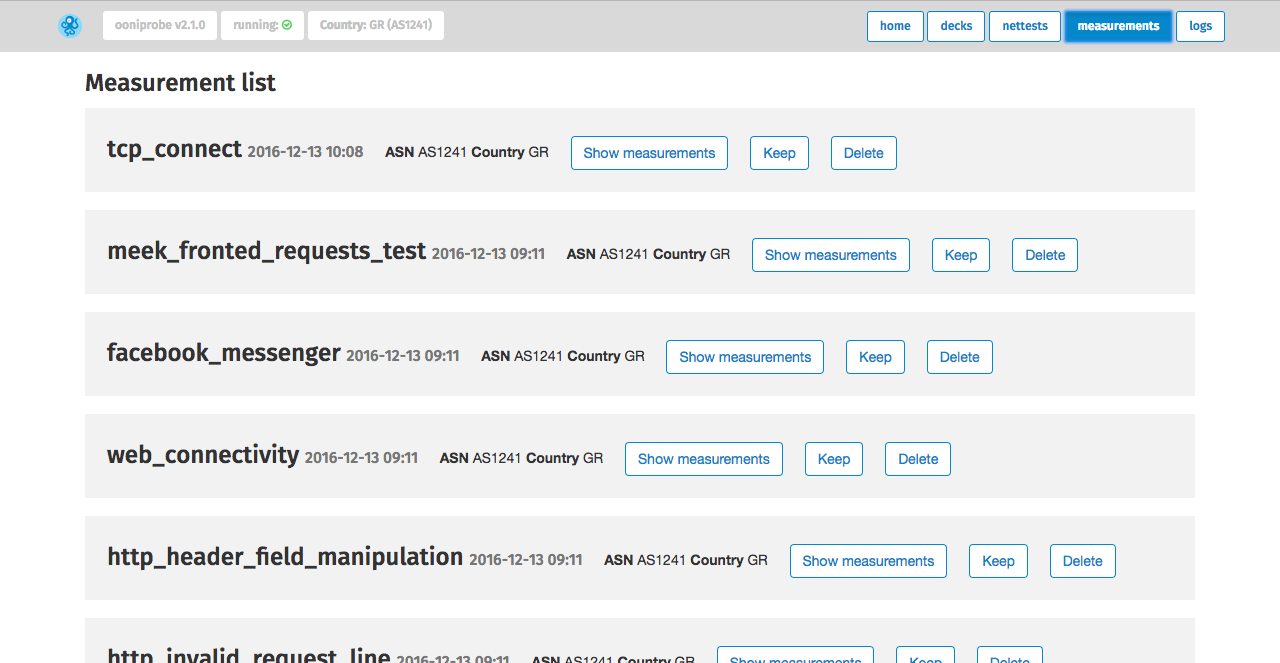
You can view the results of your measurements by clicking on Show measurements
next to each type of test. The Web Connectivity measurements, for example, will
show the results pertaining to the various URLs that you tested for censorship.
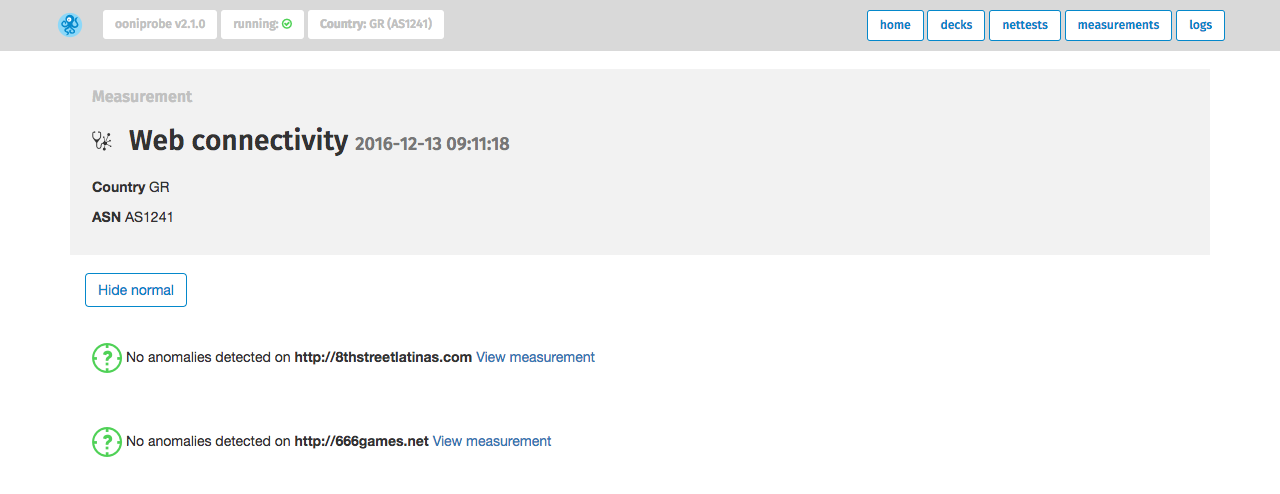
To only view the results for the URLs that presented network
anomalies, click Hide normal.
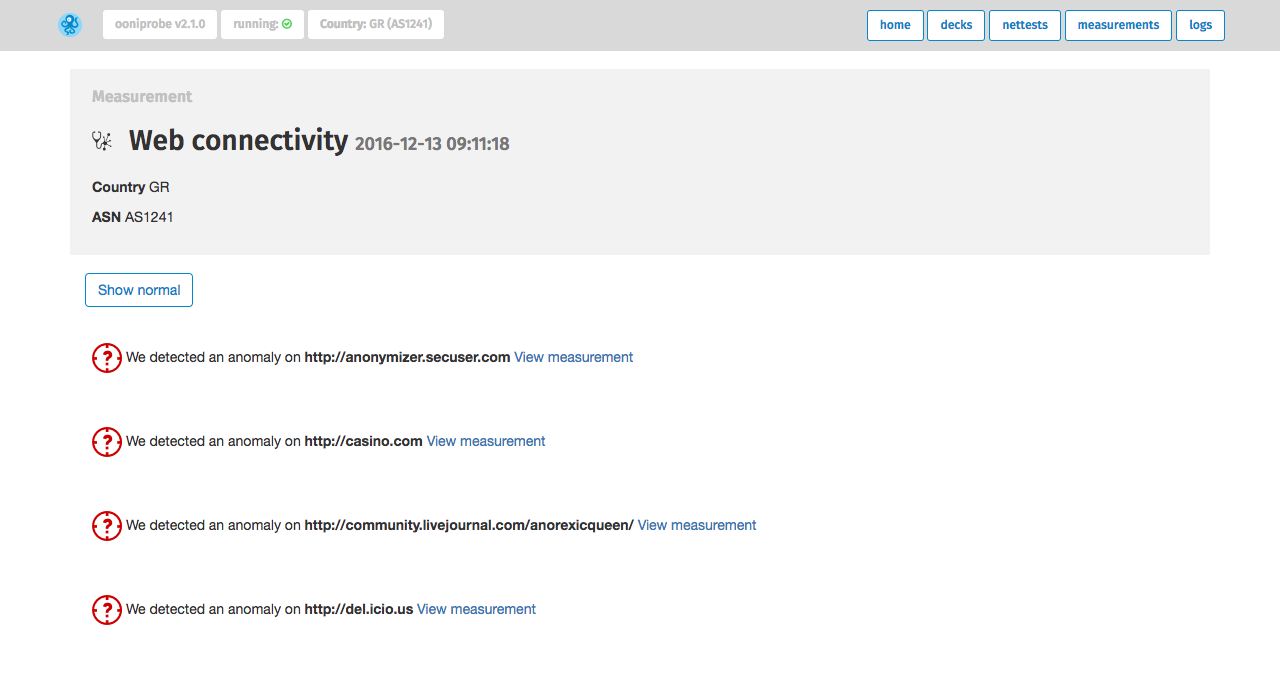
To view the collected data illustrating how and why the testing of a specific
URL presented network anomalies, click View measurements. Below we illustrate an
example where casino.com appeared to be censored.
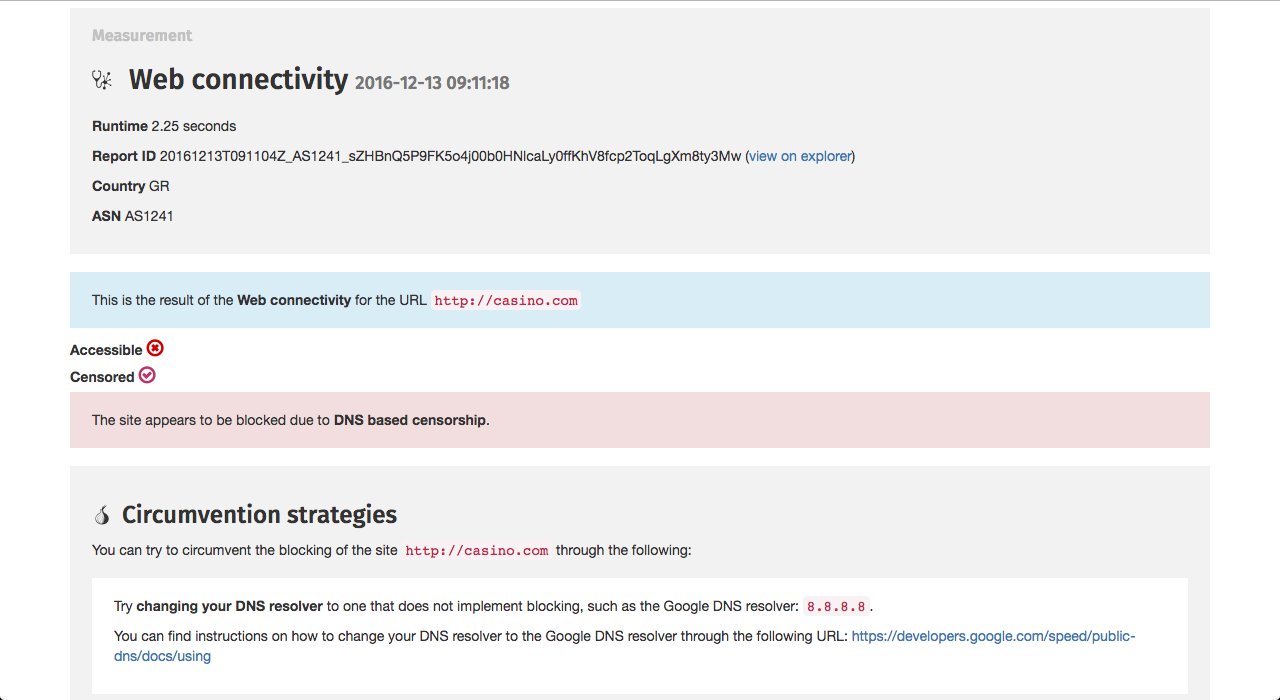
The start of the page presents you with the key findings on whether a site was
accessible and/or censored when it was tested. If the site was found to be
censored, you will be presented with a concise explanation of how it was blocked
(for example, based on a difference in HTTP responses). Further information
about this can be found towards the end of the page in the published network
measurement data.
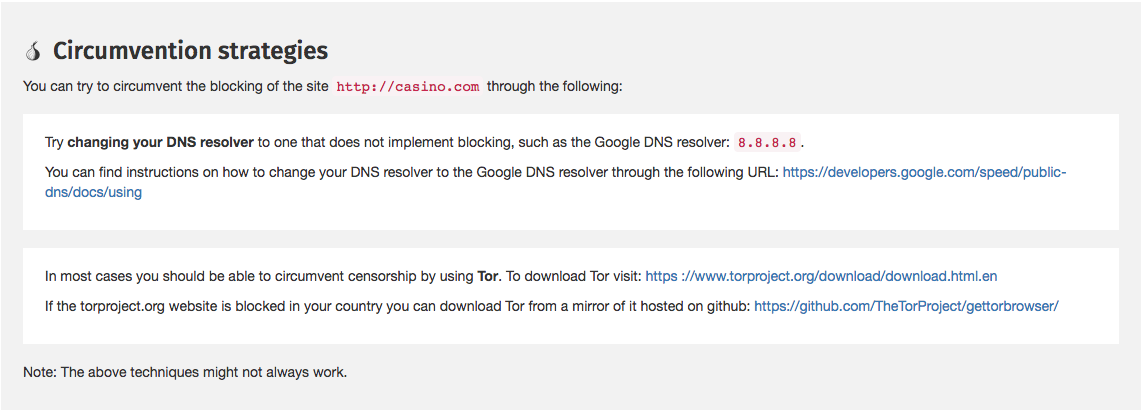
If censorship has been detected, you will be presented with tips on how to
circumvent that specific type of censorship and access the site in question.
It’s worth noting though that you might come across false positives and false
negatives in the data due to a number of reasons. DNS resolvers (operated by
Google or a local ISP) often provide users with IP addresses that are closest to
them geographically. While this might appear to be a case of DNS tampering, it
is actually done with the intention of providing users with faster access to
websites. Similarly, you might come across false positives when tested websites
serve different content depending on the country that the user is connecting
from, or in the cases when websites return failures even though they are not
tampered with. Moreover, measurements indicating HTTP or TCP/IP blocking might
actually be due to temporary HTTP or TCP/IP failures, and might not conclusively
be a sign of network interference.
Therefore it’s important to remember that the web UI provides you with access to
measurement data that was flagged as anomalous, and that not every anomalous
measurement is a confirmed case of censorship. Unless a measurement presents a
block page in the HTTP response body, data should be cross-correlated across
time to reach more accurate conclusions.
Feedback? Contact us, we’d love to hear from you!